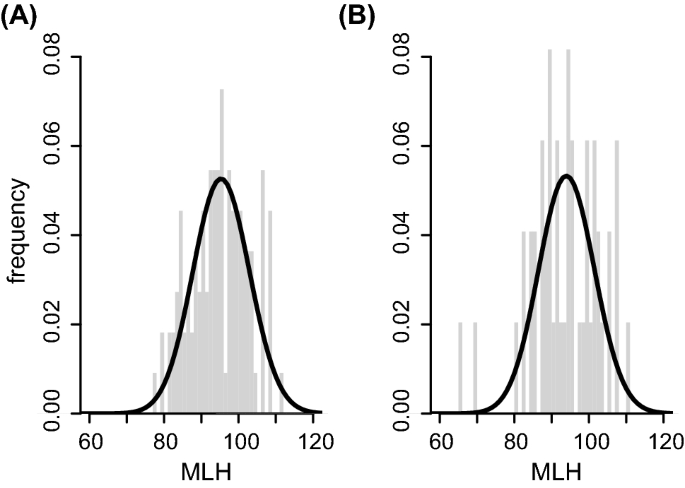
Observed heterozygosity is a measure of genetic diversity within a population. It is calculated by looking at the number of different alleles (variants) at a particular locus (position) in the genome, and comparing it to the maximum possible number of alleles that could be present at that locus. The observed heterozygosity is then expressed as a proportion, with values ranging from 0 to 1.
A population with high observed heterozygosity is considered genetically diverse, as it has a large number of different alleles present. This can be beneficial for the population as a whole, as it can increase the adaptability of the population to changing environments and help to protect against diseases. On the other hand, a population with low observed heterozygosity is considered genetically homogenous, with fewer alleles present. This can make the population more vulnerable to environmental changes and diseases, as there is less genetic variation to draw upon in order to adapt and respond.
There are several factors that can influence observed heterozygosity in a population. One is the size of the population. Smaller populations tend to have lower observed heterozygosity, as there is less opportunity for genetic variation to occur. Inbreeding, or the mating of closely related individuals, can also reduce observed heterozygosity, as it increases the frequency of homozygous individuals (individuals with two copies of the same allele at a particular locus) and decreases the frequency of heterozygous individuals (individuals with two different alleles at a particular locus).
Observed heterozygosity can also be influenced by the mating system of a population. In populations with random mating, individuals are equally likely to mate with any other individual in the population, which can result in high levels of observed heterozygosity. In contrast, populations with non-random mating systems, such as those with a hierarchical mating structure, can have lower levels of observed heterozygosity due to a lack of genetic exchange between different subgroups within the population.
Observed heterozygosity is an important concept in the field of population genetics, as it provides a measure of the genetic diversity within a population. Understanding observed heterozygosity can help to inform conservation efforts and guide breeding programs, as well as help to understand the potential impacts of genetic factors on the health and adaptability of a population.
R: Reports observed, expected and unbiased heterozygosities and...

Samples of twenty-five Lake Trout were collected from three lakes: Devil, Eagle and Loughborough, all three of which are situated north of Kingston, Ontario. Low heterozygosity means little genetic variability. High gene flow will tend to maintain genetic similarity among populations. The average and minimum Ho are similar to these in the Coton de Tulear, but the highest heterozygosity is about 0. Hello lovely VCFtools people, I am trying to calculate individual heterozygosity and SNP heterozygosity.
blog.sigma-systems.comzygosity: Reports observed, expected and unbiased heterozygosities and... in dartR: Importing and Analysing 'SNP' and 'Silicodart' Data Generated by Genome

So far, we were saying: to look at expected heterozygosity per pop use {adegenet} and use Hs , and then I was sharing some code doing Hobs but I would rather build on existing packages. Their mutations will increase or maintain genetic variation but those mutations will be different from the mutations arising in the related populations. We will now examine each of the other four forces of evolutionary change -- migration, mutation, drift and selection. A sister journal, Conservation Genetics Resources, provides rapid publication of technical papers on methodological innovations or improvements, computer programs, and genomic resources. For each of these parameters is standardized by the number of entries in that particular group. Genetic variation within a population is important in maintaining or increasing the fitness of members in the population and ultimately the survival of the species.
[Vcftools

As population size decreases, the force of drift increases, and vice versa. For a 1-level analysis, we can perform this in R by first setting up the data as a distance matrix and a vector of population assignments it appears that the values need to be either numeric or as a factor for populations, though at the time of this writing, I could not get a factor representation to work properly. Selection generally removes genetic variation from the population occasionally special circumstance such as "frequency-dependent" or "balancing" selection can serve as forces maintaining variation. Numerical values for observed heterozygosity Ho were then generated using the data and the Doh heterozygosity calculator. Mutation is difficult to measure or observe directly, and rates of mutation can vary between loci.
An Analysis of the Observed Heterozygosity of Lake Trout

This is because, as Wright 1984, pg 82 pointed out: The fixation index is thus not a measure of degree of differentiation in the sense implied by the extreme case by absence of any common allele. Ferguson 1990 found similar information that affects diversity among rainbow trout Oncorhynchus mykiss and concluded that heterozygosity levels were proven to have a direct relationship between the sex, size and age of the fish. For example, the maximum heterozygosity for a 10-allele system comes when each allele has a frequency of 0. The rest of the expression p 2 + q 2 is the homozygosity. The important component here is that there are a lot of ways that a set of population histories may result in the same amount of genetic variation. In a tetraploid it will be 1 for a fully het call ABCD , 0 for a fully hom call AAAA and between 0 and 1 for any other call. I thus close the issue.


