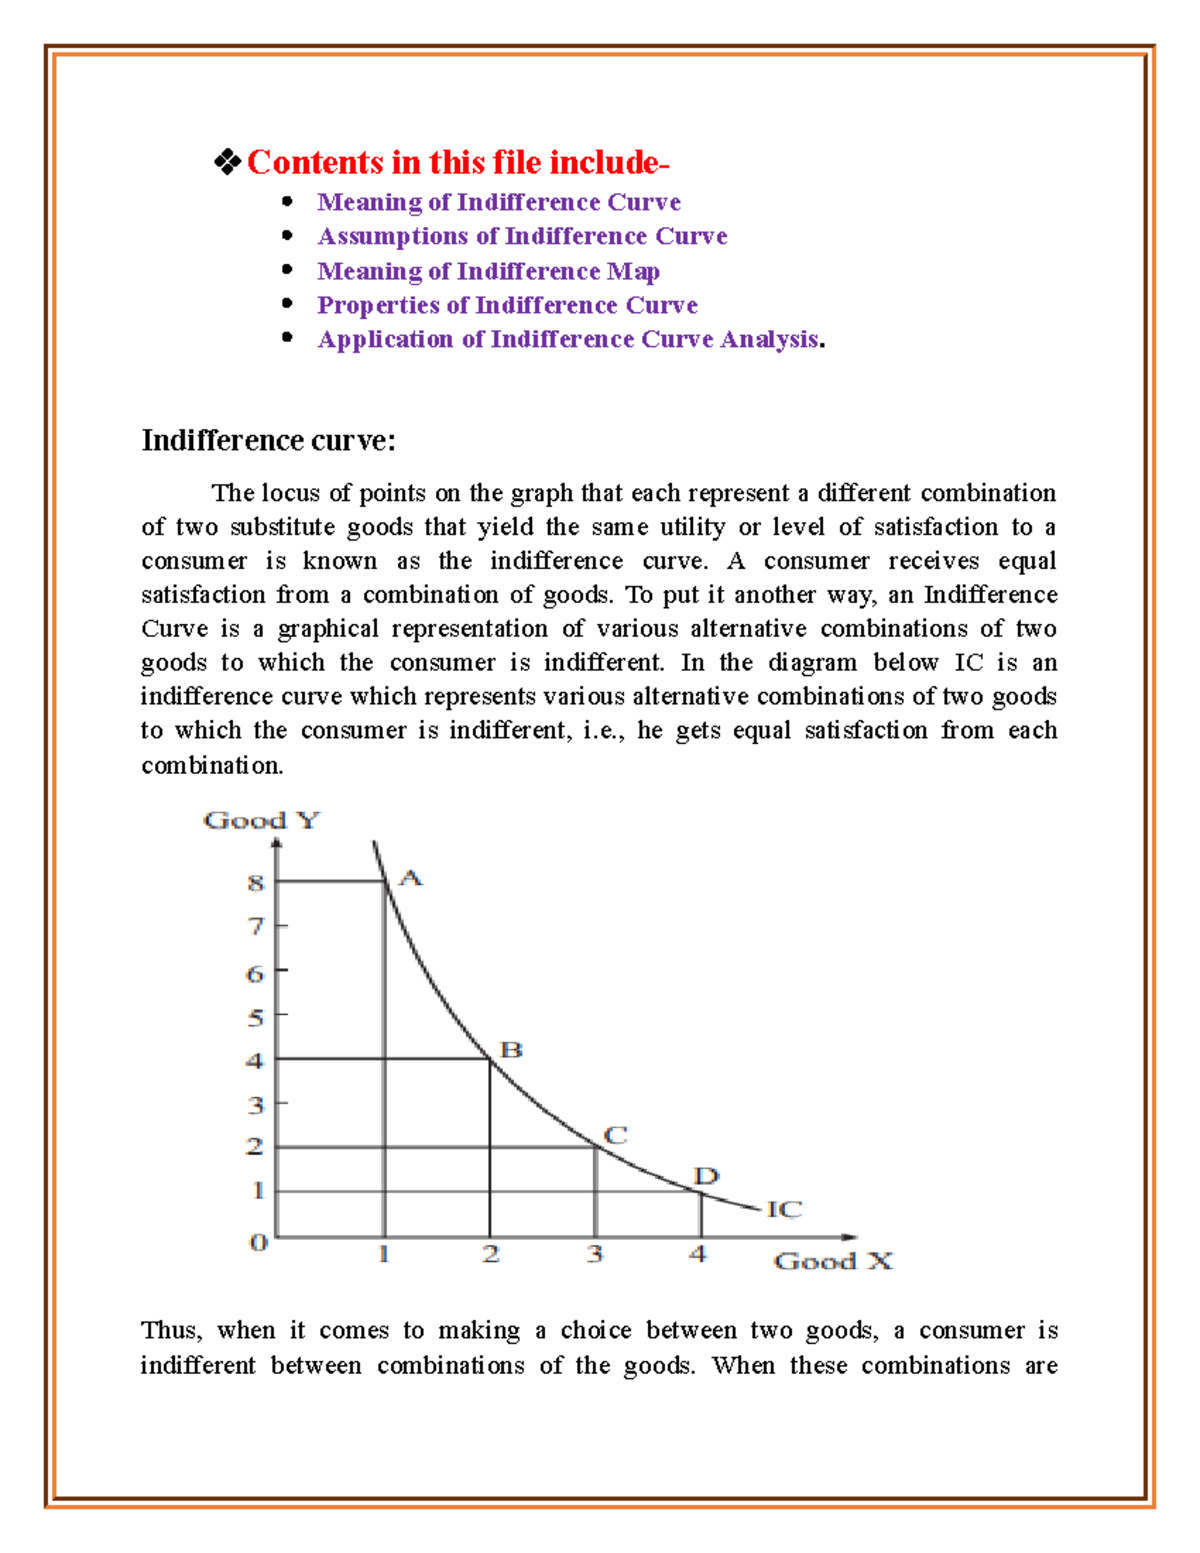
An indifference curve is a graphical representation of a consumer's preferences for two goods or services. It shows the combination of the two goods that would provide the same level of satisfaction or utility to the consumer. The indifference curve is a useful tool in economics because it helps to understand how a consumer's preferences change as the price or availability of goods changes.
An indifference curve is typically plotted on a graph with one good on the x-axis and the other good on the y-axis. The curve itself represents all the combinations of the two goods that provide the same level of satisfaction to the consumer. The higher the curve, the more of both goods the consumer is willing to consume to maintain a given level of satisfaction.
There are a few key properties of an indifference curve that are important to understand. First, an indifference curve is downward sloping, which means that as the quantity of one good increases, the quantity of the other good must decrease in order for the consumer to maintain the same level of satisfaction. This is because, as the quantity of one good increases, the consumer's utility or satisfaction from consuming that good decreases, so they must compensate by consuming more of the other good.
Second, indifference curves are convex to the origin, which means that they curve inward as they approach the x and y axes. This reflects the fact that, as the quantity of one good increases, the marginal utility or satisfaction gained from consuming that good decreases. As a result, the consumer is willing to give up more of the other good in order to maintain the same level of satisfaction.
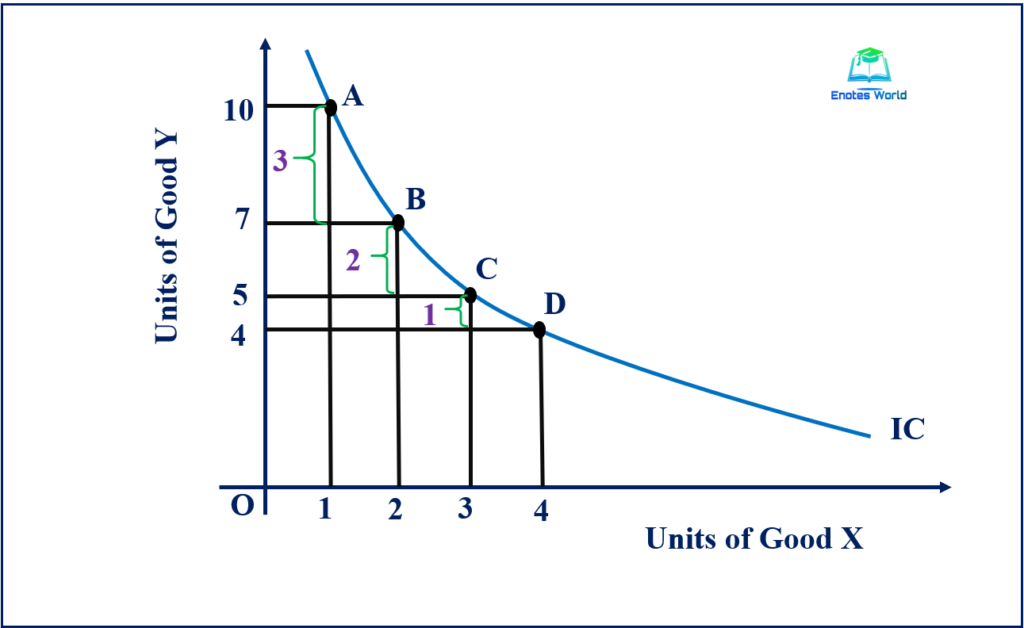
Finally, indifference curves are non-intersecting, which means that they do not intersect or overlap with one another. This reflects the fact that a consumer's preferences for different combinations of goods are unique and cannot be ranked equally.
Indifference curves are often used in economic analysis to understand how consumers make decisions about what to buy and how much to buy. For example, if the price of one good increases, the consumer may choose to substitute a cheaper alternative in order to maintain their desired level of satisfaction. Indifference curves can also be used to compare the preferences of different consumers and to understand how changes in the market affect consumer behavior.
Overall, indifference curves are a valuable tool for understanding consumer behavior and making economic decisions. They help to illustrate how a consumer's preferences change as the price and availability of goods change, and how consumers make trade-offs between different goods in order to maximize their satisfaction.
How To Graph An Indifference Curve
Point F has greater consumption of both books five to three and doughnuts 100 to 84 , so point F is clearly preferable to point B. Will Quentin react to the lower rate of return by saving more, or less, or the same amount? Indifference curve analysis is based on the axiom of diminishing marginal rate of substitution. For example, points A and B sit on the same indifference curve Um, which means that they provide Lilly with the same level of utility. If income rises by, for example, 50%, exactly how much will a person alter consumption of books and doughnuts? If an apple costs £1 and a banana £2, the above budget line shows all the combinations of the goods which can be bought with £40. In other words, they are steeper on the left and flatter on the right. If you insert point B so that it lies a little to right of the original point A, then the substitution effect will exceed the income effect. An Indifference curve shows the various commodity combinations which give the same level of satisfaction.
What is Indifference Curve: Definition, Assumptions, Properties
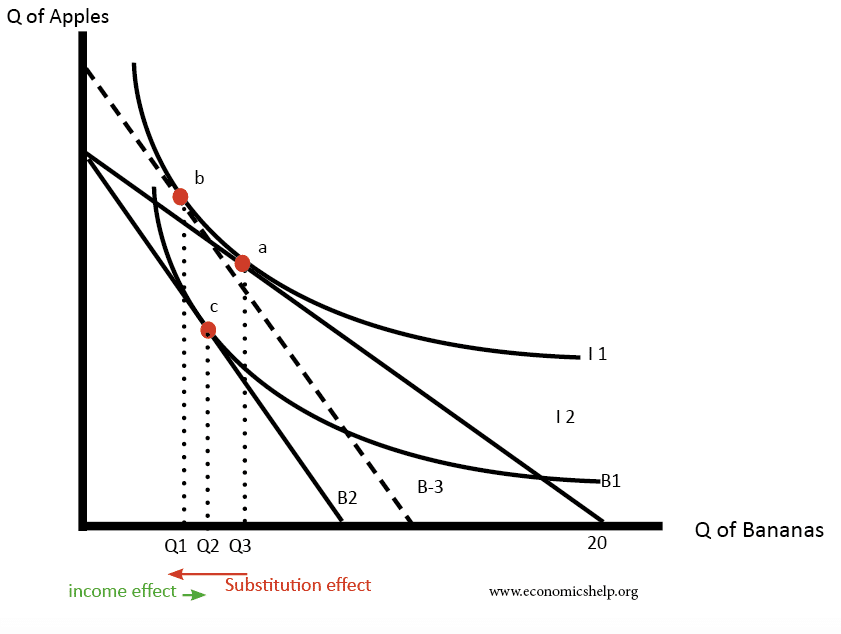
This line is a graphical tool that allows you to distinguish between the two changes: 1 the effect on consumption of the two goods of the shift in prices—with the level of utility remaining unchanged—which is the substitution effect; and 2 the effect on consumption of the two goods of shifting from one indifference curve to the other—with relative prices staying unchanged—which is the income effect. The dashed line serves as the tool for separating the two effects on the graph. If oranges get cheaper, people fire up their juicing machines and ease off on other fruits and foods. Over those five years, he expects to earn a total 80% rate of return. This information provides the basis for the budget line shown in budget line are shown the three indifference curves from Figure 2. Compare two different choices between points that all provide Lilly an equal amount of utility along the indifference curve Um: the choice between A and B, and between C and D.
For pizza, in this case, the substitution effect and income effect cancel out, leading to the same amount of pizza consumed. Every level of utility will have its own indifference curve. They might react to a lower rate of return by choosing the same level of present consumption and savings at choice D, or by choosing less present consumption and more savings at a point like F. In utility that a person receives is described in numerical terms. An Indifference curve shows, The various commodity combinations which give the same level of satisfaction. By setting aside the assumption of putting a numerical valuation on utility—an assumption that many students and economists find uncomfortably unrealistic—the indifference curve framework helps to clarify the logic of the underlying model. This case would be drawn on the graph so that the point of tangency between the new budget constraint and the relevant indifference curve occurred below point B and to the right.
They are only based on the assumptions that when people have less of one good they need more of another good to make up for it, if they are keeping the same level of utility, and that as people have more of a good, the marginal utility they receive from additional units of that good will diminish. Now, put the substitution and income effects together. However, other people might have different preferences. However, choice G of six books and 48 doughnuts is on lower indifference curve Ul than choice B of three books and 84 doughnuts, which is on the indifference curve Um. But we rank in the order of utility derived from them. We can mark various combinations of commodities that give a different level of satisfaction to the consumer in a two-dimensional plane. Conversely, a lower price for a good will cause the opportunity set to shift to the right, so that it is tangent to a higher indifference curve representing an increased level of utility.
Petunia starts at choice A, the tangency between her original budget constraint and the lower indifference curve Ul. Instead, it refers to the situation in which the price of a good changes, and thus the quantities of goods that can be purchased with a fixed amount of income change. In this article, we discussed the definition, assumptions, and properties of the indifference curve. Two indifference curves: point of intersection would suggest two different levels of satisfaction G and H are two points on indifference curve U1, which yield equal satisfaction. Higher Indifference Curves Are Preferred to Lower Ones Consumers will always prefer a higher indifference curve to a lower one. Conversely, if the price of a good that you have been buying rises, then the buying power of a given amount of income is diminished.
That means that when constructing an indifference curve map, one must place one good on the X-axis and one on the Y-axis, with the curve representing indifference for the consumer wherein any points that fall above this curve would be optimal while those below would be inferior and the entire graph exists within the confines of the consumer's ability income to purchase those goods. All points along a single indifference curve provide the same level of utility. In this case, the substitution effect would lead Petunia to choose less leisure, which is relatively more expensive, and more income, which is relatively cheaper to earn. Both substitution and income effects cause fewer haircuts to be consumed. In both choices, Lilly consumes one more book, but between A and B her consumption of doughnuts falls by 36 from 120 to 84 and between C and D it falls by only five from 40 to 35. By joining these commodity combinations, we can form an indifference curve.
Understanding Indifference Curves and How to Plot Them
On the other hand, G and J are two points on the indifference curve U2, which yield equal satisfaction. The substitution and income effects of a wage decrease would reverse these directions. If the price of a good that you have been buying falls, then in effect your buying power has risen—you are able to purchase more goods. Since an indifference curve represents a set of choices that have the same level of utility, Lilly must receive an equal amount of utility, judged according to her personal preferences, from two books and 120 doughnuts point A , from three books and 84 doughnuts point B from 11 books and 40 doughnuts point C or from 12 books and 35 doughnuts point D. It is the ratio of the units omitted from commodity Y and the amount of units substituted from commodity X. Again, the language of substitution and income effects provides a framework for thinking about the motivations behind various choices.
And also assumed that it is diminishing. Choices B and G are both on the opportunity set. Whenever a price changes, consumers feel the pull of both substitution and income effects at the same time. In short, the slope of the indifference curve changes because the marginal rate of substitution—that is, the quantity of one good that would be traded for the other good to keep utility constant—also changes, as a result of diminishing marginal utility of both goods. . The key tool in distinguishing between substitution and income effects is to insert a dashed line, parallel to the new budget line. There are commodity combinations that give the same level of satisfaction, even if the commodity combination difference.
The income effect is the movement from C to B, showing how choices shifted as a result of the decline in buying power and the movement between two levels of utility, with relative prices remaining the same. Similarly, any points on the middle indifference curve Um provide greater utility than any points on the lowest indifference curve Ul. Indeed, the slope along an indifference curve as the marginal rate of substitution, which is the rate at which a person is willing to trade one good for another so that utility will remain the same. As shown in The size of these income and substitution effects will differ from person to person, depending on individual preferences. Economists use an indifference curve to explain how people make tradeoffs when confronted with two products that they want to buy.