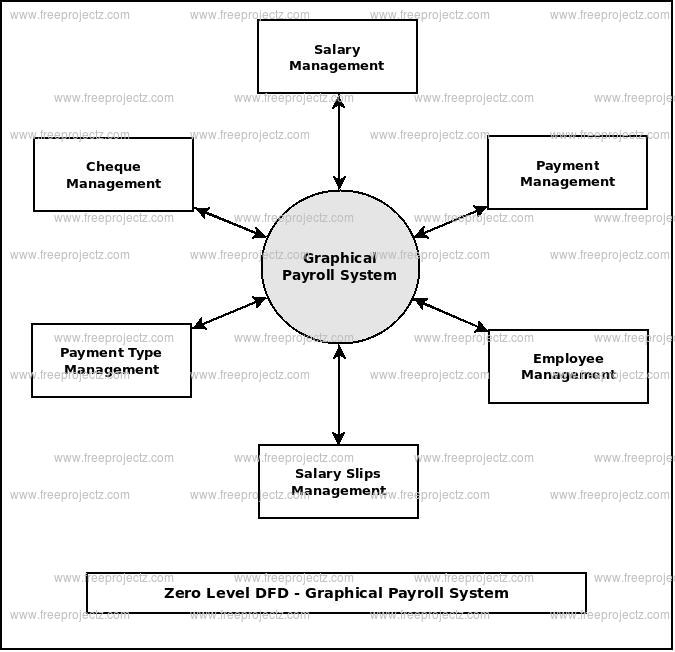
A data flow diagram (DFD) is a graphical representation of the flow of data within a system. It is used to visualize the movement of data from its source to its destination, as well as the transformation of data as it moves through the system. In the context of a payroll management system, a DFD can be used to model the flow of data related to the processing of employee payroll.
The DFD typically consists of a series of interconnected symbols that represent the different components of the system, such as processes, data stores, and external entities. The DFD also includes arrows that represent the flow of data between these components.
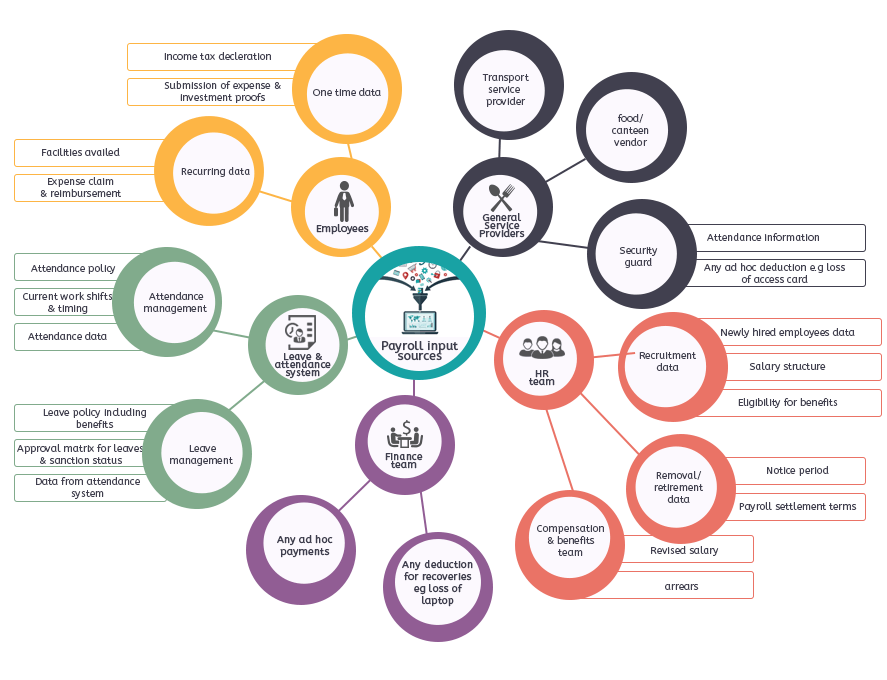
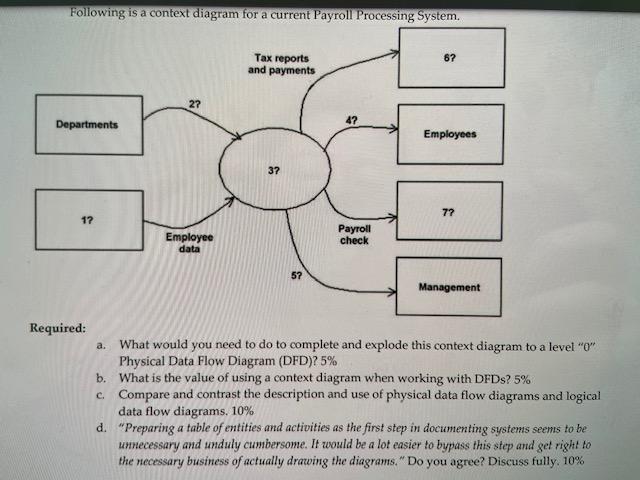
In the case of a payroll management system, the external entities might include employees, who provide their personal and financial information to the system; and external agencies, such as tax authorities, to which the system sends tax and other financial information.
The data stores in a payroll management system might include a database of employee information, a database of payroll data, and a database of financial transactions. These data stores might be accessed by processes such as data entry, payroll calculation, and payment processing.
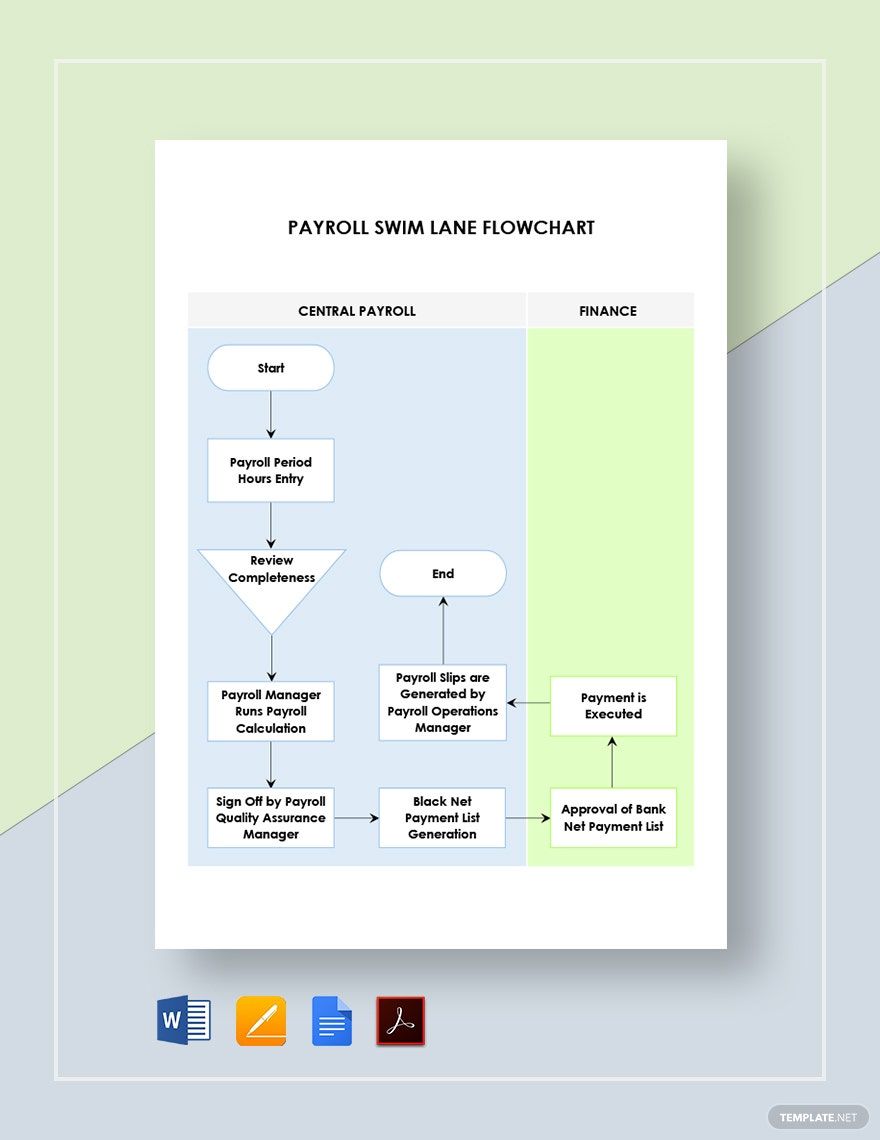
The processes in a payroll management system might include activities such as entering employee data, calculating payroll, issuing paychecks or direct deposits, and updating financial records. These processes might be triggered by events such as the submission of employee timesheets or the end of a pay period.
A DFD can be used to model the flow of data in a payroll management system at various levels of detail, depending on the needs of the system and the audience for the diagram. For example, a high-level DFD might show the flow of data between the external entities and the data stores, while a more detailed DFD might show the flow of data between the different processes and data stores within the system.
Overall, a data flow diagram is a useful tool for understanding and documenting the flow of data within a payroll management system. It can help stakeholders to visualize the movement of data throughout the system and identify potential bottlenecks or inefficiencies in the flow of data.

